|
China GDP per capita: Time required to catch up with the USA
Stephen
Chung Managing Director
Zeppelin
Real Estate Analysis Limited
January 2006
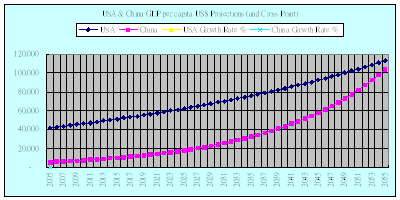
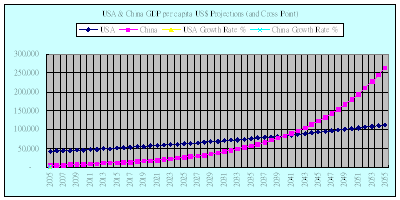
Recent news media reports indicated that China is now the 4th largest economy in the world with its sheer size and fast economic growth. Not a small feat by any standard and many expect, experts included, China to continue growing notwithstanding the many challenges along the way. This global economic position is based on overall GDP and though the GDP per capita in China, based on data abstracted from www.econstats.com, remains small at around US$1411, the 1.30 billion population makes the total GDP a formidable figure. While there have been projections on when China GDP as a whole may become the largest economy surpassing even the USA etc, there are few estimates on the GDP per capita. Hence, your humble author has decided out of pure curiosity to do a few simple calculations, noting the following: 1) The following are just calculations = they are NOT projections, predictions, or estimates of future GDPs per capita. They merely make some simple assumptions of GDP per capita growth rates which are then applied to current GDPs per capita and spread over 100 years or so ahead. By so doing, a sense of how much is required to catch up with the USA or other major economies could be obtained, though pardon us for repeating, this by itself is NOT a confirmation that such growths are guaranteed.
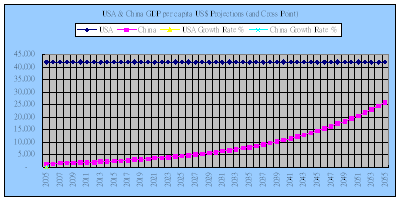
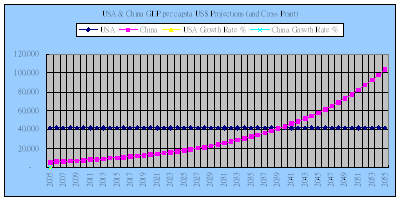
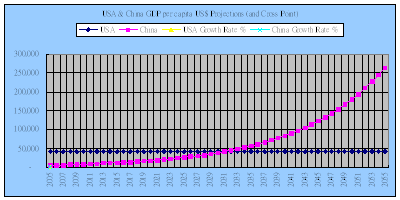
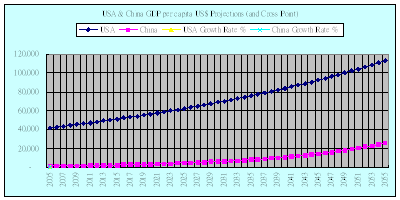
2) The assumptions are subjective = as the calculation parameters and possibilities are infinite, your humble author has to make subjective selections on the set of figures to be applied. Essentially, China, as a developing economy and an emerging market, is assumed to exhibit higher growth rates than the more mature USA economy, and different levels of growth rates have been applied to give a sense of possibilities. Naturally, the (starting off) current GDP per capita used in the calculations are quite different, US$1411 for China and US$41917 for the USA. Shanghai = this is included just for interest. Reportedly, the GDP per capita for Shanghai is around 4 times that of China and thus a figure of US$5644 was assumed. Obviously, Shanghai with a higher starting off figure will probably take fewer years to reach a GDP per capita level comparable to that of the USA. Admittedly, Shanghai could be compared to a counterpart metropolitan in the USA yet this was not done for this exercise, in part because the USA metro GDP per capita is unlikely to be 4 times the overall USA GDP per capita. And here are the observations: A) USA GDP per capita no growth at 0%, China 6% = catch up year 2064 [note: the chart is good until year 2055 though our calculations go up to year 2100]
B) USA GDP per capita no growth at 0%, China 8% = catch up year 2050
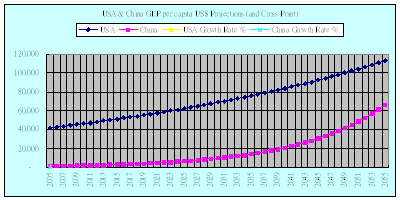
C) USA GDP per capita no growth at 0%, China 10% = catch up year 2041
D) USA GDP per capita no growth at 0%, China 12% = catch up year 2035
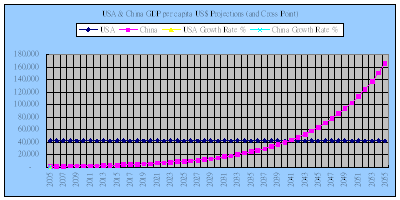
E) USA GDP per capita no growth at 0%, Shanghai 6% = catch up year 2040
F) USA GDP per capita no growth at 0%, Shanghai 8% = catch up year 2032
G) USA GDP per capita no growth at 0%, Shanghai 10% = catch up year 2027
H) USA GDP per capita no growth at 0%, Shanghai 12% = catch up year 2023
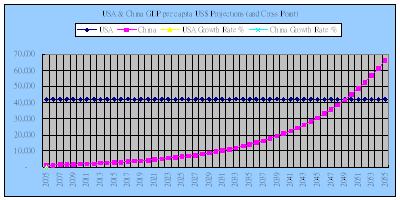
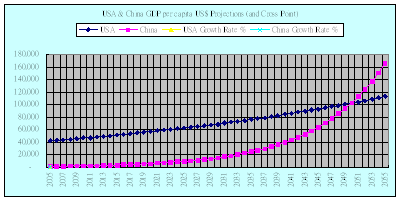
I) USA GDP per capita at 2%, China 6% = catch up year 2094
J) USA GDP per capita at 2%, China 8% = catch up year 2065
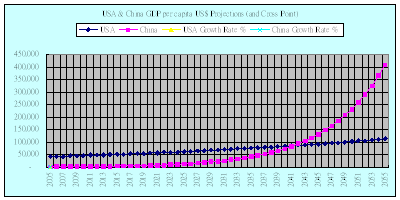
K) USA GDP per capita at 2%, China 10% = catch up year 2050
L) USA GDP per capita at 2%, China 12% = catch up year 2042
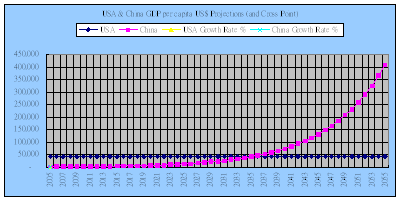
M) USA GDP per capita at 2%, Shanghai 6% = catch up year 2058
N) USA GDP per capita at 2%, Shanghai 8% = catch up year 2041
O) USA GDP per capita at 2%, Shanghai 10% = catch up year 2032
P) USA GDP per capita at 2%, Shanghai 12% = catch up year 2027
Further technical notes: 1) Straight line growth rates for simplicity’s sake = yet eventual / actual rates may vary for different periods and may even be negative at times. There is no implied guarantee that economies, developed / mature or developing / young, will only grow.
2) No growth scenario for the USA is used for illustration only = and to give a sense of how long it may take to catch up even if the USA is assumed to exhibit no further growth. This by itself is NOT an implication that the USA will not grow in future (or will definitely grow for that matter).
3) China is assumed to exhibit higher growth rates = and a range of 6% to 12% is used, though actual future growth rates, if any, may fall within or differ from this range. Nonetheless, 6% is not unseen before in other economies e.g. the UK GDP per capita grew by 5.90% per annum from 1980 to 2005 while the USA GDP per capita increase by around 5% per annum. Hong Kong GDP per capita also expanded in the same period averaging around 6.10% per annum. While the foregoing offer no guarantees that China will have at least a 6% or so growth rate for its GDP per capita, they do show that 6% or so may be a reasonable expectation. In any event, more optimistic growth rates have also been used here.
4) Catching up is faster when China grows faster and / or the USA grows slower or not at all = and vice versa, stating the obvious. Note also the possibility that Shanghai may grow at a faster pace than that for overall China, though again this is not a guarantee written in stone. In summary, a possibility is that assuming the USA is to grow at a much slower pace, then China overall may catch up with the USA’s GDP per capita sometime in the latter half of this (21st) century. Shanghai, on the other hand, may do so sometime in the first half of this century. As GDP per capita seems to exhibit some correlation to real estate prices, residential ones in particular, Shanghai real estate is still probably one of the, if not the, fastest investment markets (or asset classes) to reach a price level comparable to that of the USA. Notes: The article and/or content contained herein are for general reference only and are not meant to substitute for proper professional advice and/or due diligence. The author(s) and Zeppelin, including its staff, associates, consultants, executives and the like do not accept any responsibility or liability for losses, damages, claims and the like arising out of the use or reference to the content contained herein. |

Phone (852) 37576388 Fax (852) 37576399 E-mail contact@real-estate-tech.com
Address c/o Zeppelin, Unit 1007, 10/F, CCT Telecom Building, 11 Wo Shing Street, Shatin, NT, Hong Kong
Copyright rests with Zeppelin and/or relevant authors